

Performance Insights helps quality managers and supervisors analyze agent communication quality and behavioral trends over time. It combines key agent metrics such as empathy, crutch word usage, evaluation scores, sentiment, and playbook adherence into a single dashboard to support trend analysis, coaching, and performance improvement. The dashboard supports Both, Inbound, and Outbound contact direction filters. When applied, all metrics, charts, and adherence data update to reflect only the selected interaction type.Documentation Index
Fetch the complete documentation index at: https://koreai-v2-agent-platform-dev.mintlify.app/llms.txt
Use this file to discover all available pages before exploring further.
Access Performance Insights
Navigate to Quality AI > Analyze > Performance Insights.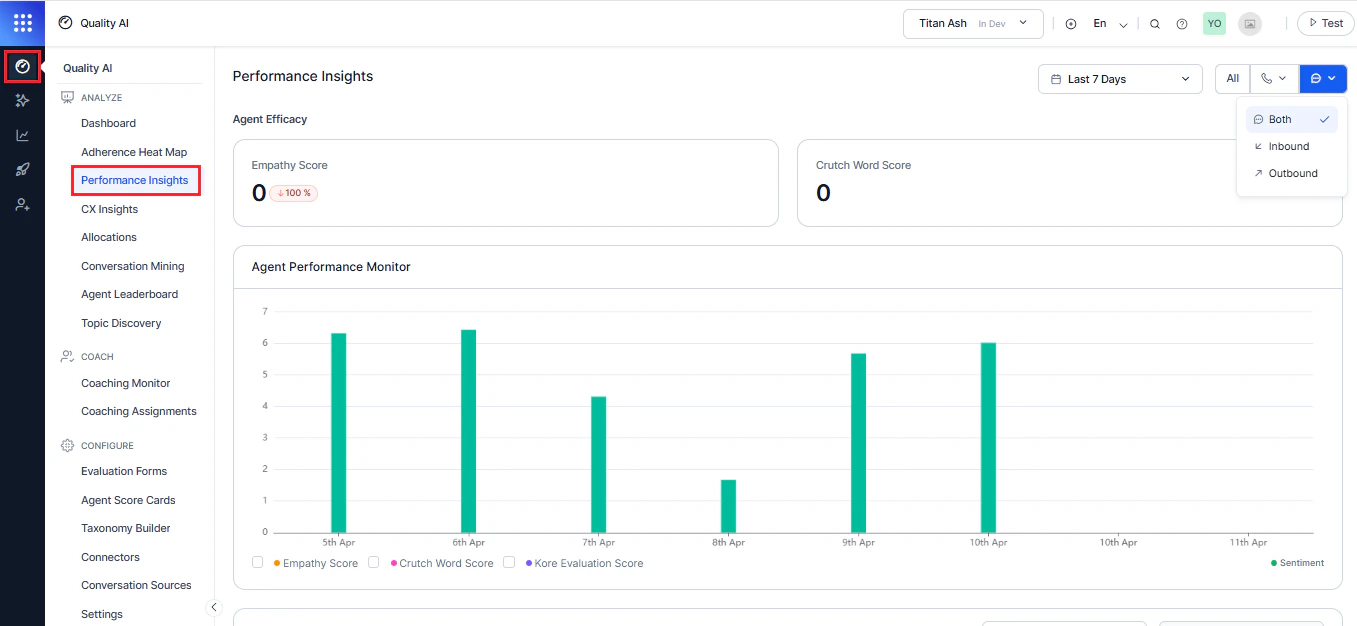
Enable Conversational Intelligence in Settings to access Performance Insights, agent insights, and conversation-level analytics.
Why Use Performance Insights?
| Use Case | How It Helps |
|---|---|
| Trend Monitoring | Tracks agent communication quality and behavioral trends over time. |
| Coaching Support | Identifies improvement areas for targeted coaching. |
| Metric Correlation | Connects agent behavior with outcomes such as CSAT and sentiment. |
| Directional Analysis | Compares performance across inbound and outbound interactions. |
| Script Compliance | Measures adherence to predefined playbooks and workflows. |
| Cross-Queue Visibility | Users with Cross Queue Data Access can view agent performance across all queues. |
Key Capabilities
- Agent Efficacy Metrics: Monitors empathy, crutch word usage, and evaluation scores.
- Trend Visualization: Tracks performance changes over selected time periods.
- Agent Performance Monitor: Time-series visualization of key metrics (Empathy, Crutch Words, Evaluation Score, Sentiment, CSAT) to analyze trends, correlations, and coaching opportunities.
- Correlation Insights: Compares agent metrics with customer experience indicators (for example, Empathy vs. CSAT, Crutch Words vs. Satisfaction).
- Playbook Adherence: Bar graph showing compliance with scripted workflows (for example, Greeting, Branding) along with trend comparisons.
- Directional Analysis: Filter-based analysis by channel and contact direction (Inbound, Outbound, Both) to evaluate performance across different interaction types.
- Coaching Insights: Identifies high performers and areas needing improvement.
Filters
You can use filters to evaluate Performance Insights data by date range and communication channels selection.Date Range
Filter performance insights data for a selected time period: Last 7 Days (default), Last 28 Days, Last 30 Days, Last 90 Days, or a custom date and time range. Select Apply after choosing a date range.Channel and Contact Direction
The channel filter enables you to analyze performance across all channels or a specific channel with direction-based views.| Option | Description |
|---|---|
| Both | Displays data across all Inbound and Outbound conversations for the selected channel. |
| Inbound | Displays data for customer-initiated interactions only. |
| Outbound | Displays data for agent-initiated interactions only. |
Agent Occupancy displays aggregated data across all channels and is not affected by the direction filter.
Agent Efficacy
Agent Efficacy widgets summarize key communication quality metrics for agents during the selected time period and highlight performance trends compared to the previous period.Empathy Score
Measures how effectively agents respond to customer emotions.How it works
The system identifies empathy-seeking customer utterances, evaluates whether agent responses demonstrate empathy, and calculates a score based on appropriate responses.Widget displays
Displays the average empathy score for the selected period with a percentage change vs. the previous period. Upward arrow indicates improvement; downward arrow indicates decline, enabling quick trend tracking.Crutch Word Score
Measures how often agents use filler or crutch words during conversations. Example of Common Crutch Words:um, uh, like, you know, so, basically
Why it matters
Crutch word usage can reduce perceived professionalism, indicate uncertainty, slow conversation flow, and distract from the agent’s message.Widget displays
Displays the average crutch word usage score for the selected period, along with a percentage change compared to the previous period. An upward arrow indicates increased usage, while a downward arrow indicates reduced usage. Lower scores reflect clearer, more confident, and more professional communication.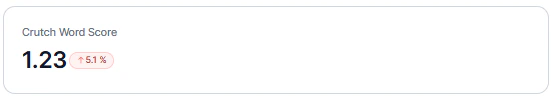
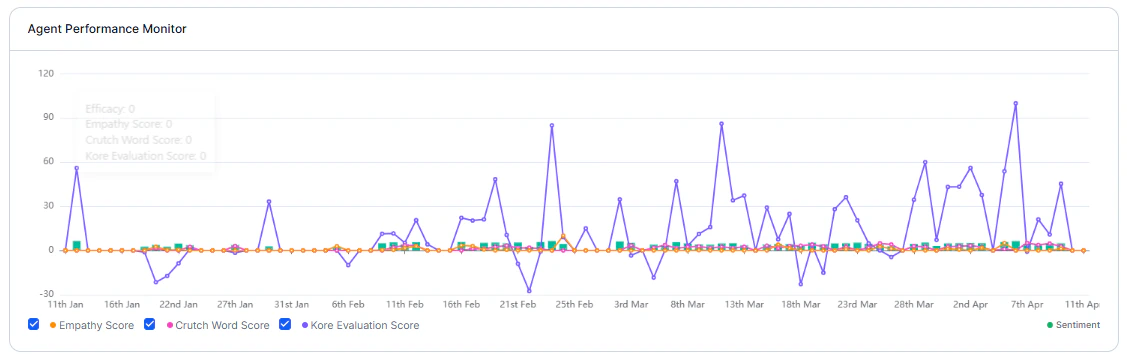
Agent Performance Monitor
The Agent Performance Monitor helps supervisors analyze metric relationships, trends, and coaching opportunities.Metrics Displayed
Empathy Score measures emotional responsiveness, Crutch Word Score tracks communication quality, and Kore Evaluation Score represents overall evaluation results.Customer Experience (X-Axis)
CSAT Score reflects customer satisfaction ratings, while Sentiment Score shows customer sentiment trends during interactions. The data is visualized as a time-series graph, with the selected date range on the X-axis and score values for each metric on the Y-axis. To use the Agent Performance Monitor,- Select one or more Y-axis metrics using the checkboxes below the chart (Empathy Score, Crutch Word Score, Kore Evaluation Score, Sentiment).
- Enable or disable individual metrics to focus the analysis and compare multiple performance indicators on the same timeline.
- Use the compare function to track changes over time and benchmark agents.
- Analyze correlations between agent behavior and customer outcomes.
- Identify coaching opportunities based on trends and quadrant positioning.
Insight Patterns
| Pattern | Meaning | Recommended Action |
|---|---|---|
| High Empathy + High CSAT | Positive customer impact | Indicates empathy drives customer satisfaction. |
| High Crutch Words + Low CSAT | Poor communication quality | Suggests filler words reduce satisfaction. |
| Top-right Quadrant* | High performers | Represents high-performing agents. |
| Bottom-left Quadrant | Needs improvement | Highlights agents who need support or targeted coaching. |
- Strong Correlations: Replicate best practices from high performers.
- Weak Correlations: Investigate other influencing factors; consider training or resources.
-
Negative Correlations: Identify and correct counterproductive behavior.
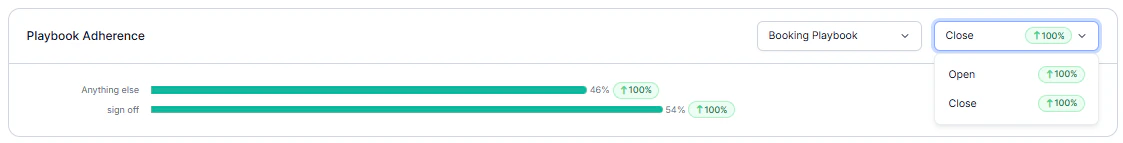
Playbook Adherence
Playbook Adherence tracks how consistently agents follow predefined scripts during customer interactions. Administrators create and manage playbooks in Agent AI. Playbooks represent scripted flows, compliance steps, or business-specific conversation stages. It helps monitor compliance and identify coaching gaps.Display format
| Element | Description |
|---|---|
| Bar Graph | Compliance percentage by step |
| Trend Comparison | Comparison with previous period |
Default Adherence Parameters
If no Agent AI playbooks are configured, adherence is measured using default conversation etiquette.| Parameter | Example |
|---|---|
| Greeting | Opening statement |
| Branding | Brand acknowledgment |
| Privacy Policy | Recording disclaimer |
| Hold Etiquette | Hold permission statement |
| Customer Verification | Identity verification |
| Proper Sign-Off | Closing statement |
Custom Playbook Selection
Use the Playbook dropdown to select a configured Agent AI playbook. The dashboard then displays adherence for the selected playbook steps and stages. Administrators can configure playbooks in Agent AI. Learn moreDisplayed only when at least one playbook exists; otherwise, empty states appear if no playbooks or stages are configured.
For customer experience analysis, see CX Insights.