

Customer Experience (CX) Insights provides a unified post-interaction view of customer experience across conversations, queues, channels, and contact directions. It helps supervisors, QA managers, and CX leaders analyze customer satisfaction, sentiment, resolution outcomes, churn risk, and key satisfaction drivers using real conversation data. Users with Cross Queue Data Access can view and filter data across all queues; otherwise, the dashboard is limited to assigned queues. The dashboard supports direction-aware analysis through the Channel filter. Selecting Inbound, Outbound, or Both updates all widgets and visualizations to display only matching interactions.Documentation Index
Fetch the complete documentation index at: https://koreai-v2-agent-platform-dev.mintlify.app/llms.txt
Use this file to discover all available pages before exploring further.
Why Use CX Insights?
| Use Case | How CX Insights Helps |
|---|---|
| Experience Monitoring | Tracks resolution, wait time, and customer sentiment trends. |
| Risk Detection | Identifies churn risk and escalation patterns early. |
| Satisfaction Drivers | Highlights topics that impact customer satisfaction positively or negatively. |
| Issue Prioritization | Helps teams focus on high-impact customer pain points. |
| Directional Analysis | Separately analyzes inbound and outbound experiences. |
| Cross-Queue Visibility | Users with Cross Queue Data Access permission can view data across all queues without individual queue assignment. |
Key Capabilities
| Capability | Description |
|---|---|
| CX Metrics | Provides a summary view of Average Wait Time, Resolution Rate, Sentiment, and Churn Monitor. |
| Overall Resolution Rate | Displays the percentage of successfully resolved interactions. |
| CSAT Drivers | Identifies topics that positively impact customer satisfaction using driver-impact scoring. |
| DSAT Drivers | Identifies topics that negatively impact customer satisfaction with detailed warning indicators. |
| Insights Mining | Displays topic clusters, keywords, and emotion trends for the selected period and channel. |
| Interaction Details | Provides conversation-level records and metadata for deeper review. |
| Direction-aware Filtering | Updates all widgets based on Inbound, Outbound, or Both contact direction selection. |
Access CX Insights
Navigate to Quality AI > Analyze > CX Insights.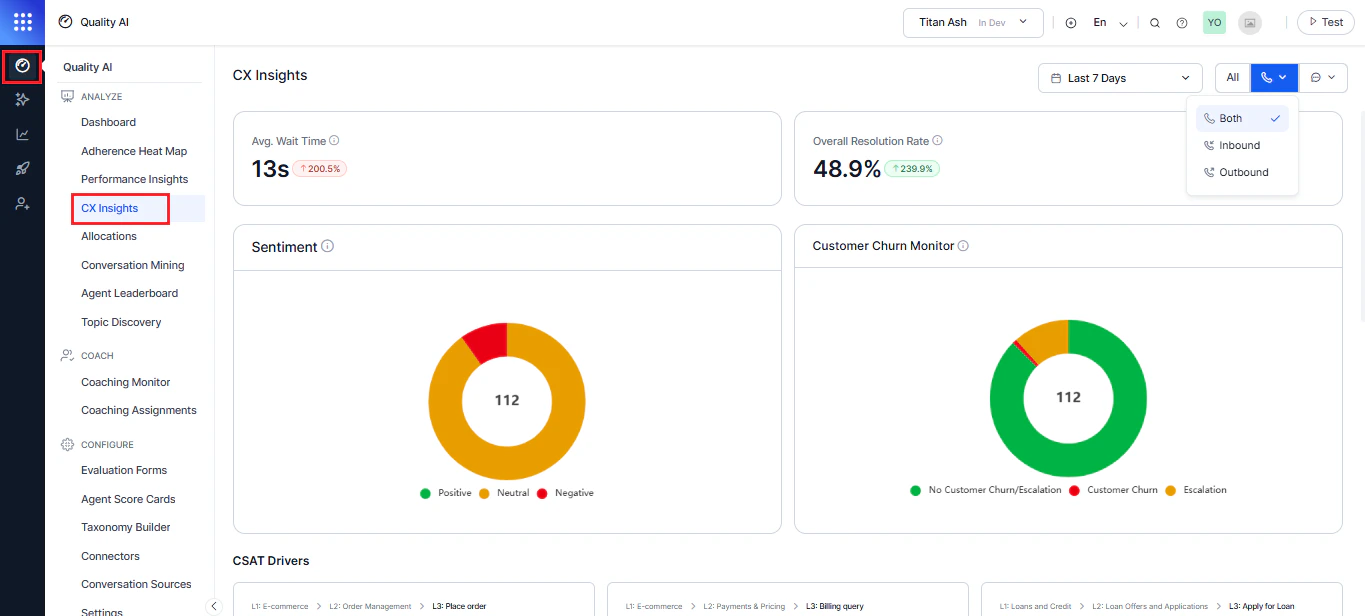
Enable the Conversational Intelligence toggle under Configure > Settings to access CX Insights and CX trends.
Filters
Date Range
Filter CX Insights data by date range (for example, Last 90 Days, Last 28 Days, Last 7 Days). The default is Today. Select a range, and select Apply after choosing the desired range.Channel and Direction
Filter CX data by channel and interaction direction. Applying this filter updates all widgets in real time. Available direction options:| Option | Description |
|---|---|
| Both | Shows inbound and outbound conversations. |
| Inbound | Shows customer-initiated interactions only. |
| Outbound | Shows agent-initiated interactions only. |
Top-Level CX Metrics
Summarizes the key customer experience performance indicators that provide a high-level view of service quality and customer experience. To see which agents or behaviors influence CX outcomes, refer to Performance Insights.Average Wait Time
Displays the average time customers wait before an agent responds. Calculation: Calculated as total wait time ÷ customers served in the period. Defaults to 0 when no data is available. What it shows: Current average wait time (for example, 8s), percentage change compared to the previous period, and a directional indicator showing increase or decrease. Use this to: Monitor accessibility and responsiveness and identify staffing or queue optimization needs.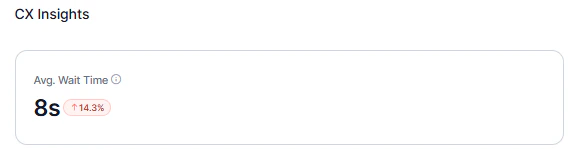
Overall Resolution Rate
Shows the percentage of interactions marked as resolved in the selected period. Displays 0% when no qualifying conversations exist. What it shows: Resolution rate percentage, comparison with the previous equivalent time range, and an improvement or decline indicator. Use this to: Track end-to-end resolution effectiveness, measure impact of process improvements, and set benchmarks.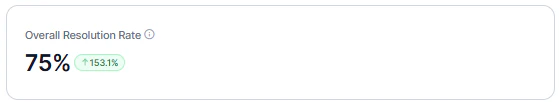
Sentiment Distribution
These widgets provide a visual summary of customer sentiment and churn risk, helping you understand overall customer mood and identify experience trends.Sentiment Category
The Sentiment widget classifies interactions as Positive, Neutral, or Negative based on average sentiment scores, reflecting overall customer emotion (for example, happy, satisfied, or disappointed). A doughnut chart shows the distribution across sentiment categories. Color coding: Positive (Green), Neutral (Yellow), Negative (Red). What it shows: Total number of interactions at the center, proportional distribution across sentiment categories, and overall customer sentiment across conversations. Displays an empty state when no conversations are processed. Use this to: Understand overall customer mood and track sentiment shifts over time. Use this to: Understand overall customer, track sentiment shifts over time, and compare topic-level experience trends.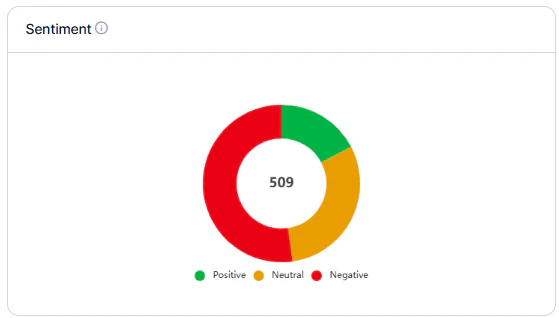
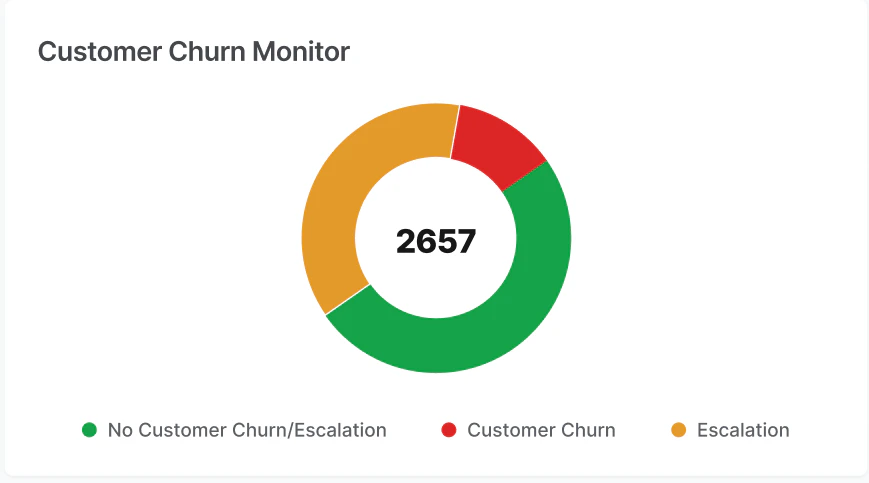
Customer Churn Monitor
Displays churn risk in a pie chart, comparing the churn percentage with total calls and escalations. Hover over a section to see its value; select a section to view related calls.Churn and Escalation Categories
| Category | Color | Description |
|---|---|---|
| No Churn or Escalation | Green | Interactions with no customer churn or escalation. |
| Customer Churn | Red | Interactions where customer churn risk detected. |
| Escalation | Yellow | Interactions where Supervisor escalation requested. |
Enable Conversational Intelligence in Configuration > Settings to populate churn insights before processing conversations.
CSAT Drivers
CSAT Drivers identify topics that positively influence customer satisfaction. The system uses a driver impact scoring model based on sentiment and topic volume.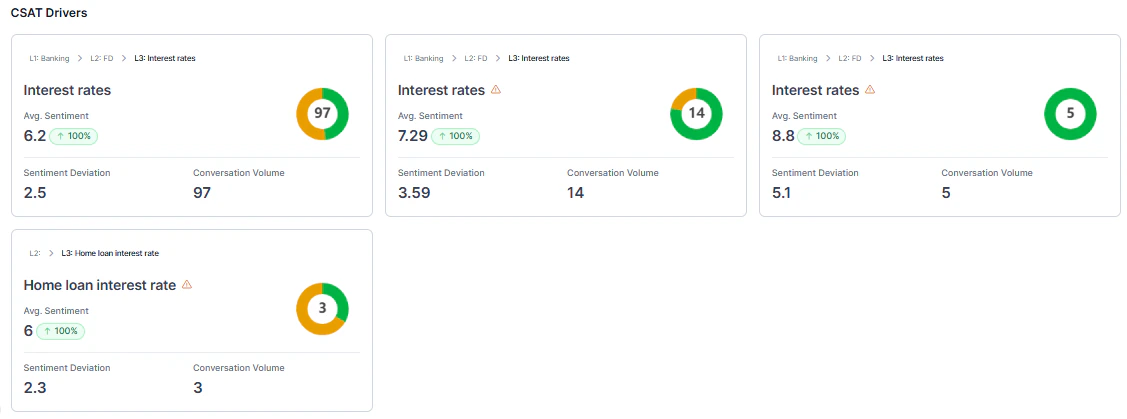
Driver Impact Formula
Driver Impact Score = (Average Sentiment − Baseline Sentiment) × Conversation Count| Component | Description |
|---|---|
| Average Sentiment | Mean sentiment score (1-10) for the topic. |
| Baseline Sentiment | Overall sentiment average for the selected filters. |
| Conversation Volume | Number of interactions tagged with the topic. |
Qualification Criteria
A topic qualifies as a CSAT driver only when it meets both:- Volume: ≥30 conversations and ≥2% of total conversations.
- Deviation: ≥0.8 sentiment points from baseline.
Driver Card Details
Each CSAT Driver card displays the topic name with taxonomy path (for example, L2: Travel Planning > L3: Cost of the Flights), average sentiment score with comparison indicator, color-coded sentiment badge, sentiment deviation from baseline, and conversation volume.Warning Indicators
Topics that don’t meet qualification thresholds display a warning appears.| Warning Type | Meaning |
|---|---|
| Volume Warning | Insufficient data for reliable insights. |
| Deviation Warning | Sentiment is close to baseline. |
| Both | Limited volume and low differentiation. |
- If 6+ qualified drivers exist: Show top 6 (no warnings).
- If fewer than 6 qualified drivers: Fill remaining slots with warning cards.
- If limited data: Show a warning message indicating insufficient data.
Baseline Calculation
The baseline adjusts based on filters applied. When multiple or all channels are selected, it uses the average sentiment across all conversations in the filtered period. When a single channel is selected, it uses the average sentiment for that specific channel within the same period.When Conversational Intelligence or Generative AI is disabled, Generative AI insights aren’t available. Enable the feature to access advanced speech analytics and CX insights. Navigate to Generative AI Tools > Gen AI Feature > Copilot to enable it.
DSAT Drivers
Highlights the top 6 DSAT (Dissatisfaction) topics that negatively impact customer satisfaction. It uses the same scoring model as CSAT Drivers, but displays topics with sentiment below the baseline.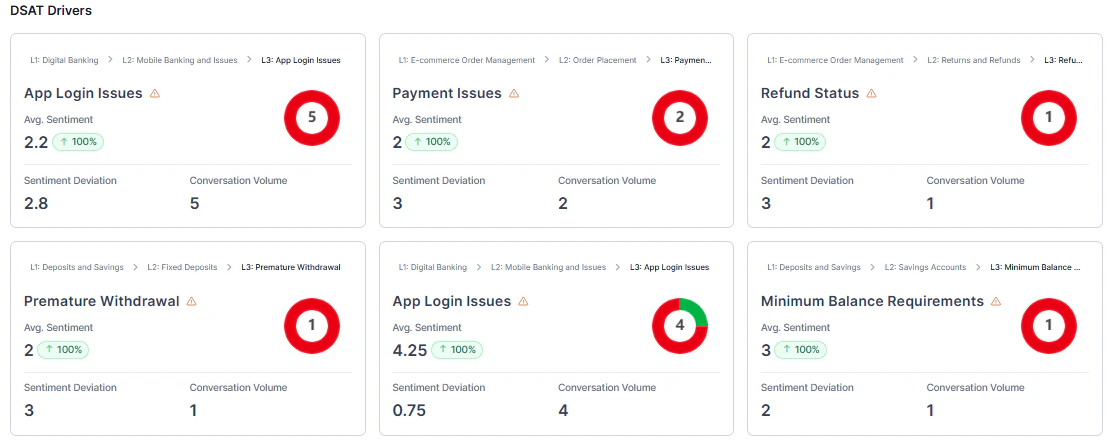
If no data is available, more conversations are needed to identify dissatisfaction drivers.
Data Handling Rules
CX Insights excludesBelow Threshold or Duration Unavailable conversations from all aggregated metrics. Manually evaluated conversations remain included. Excluded interactions don’t affect totals, averages, distributions, or driver calculations.